Drawing the first map
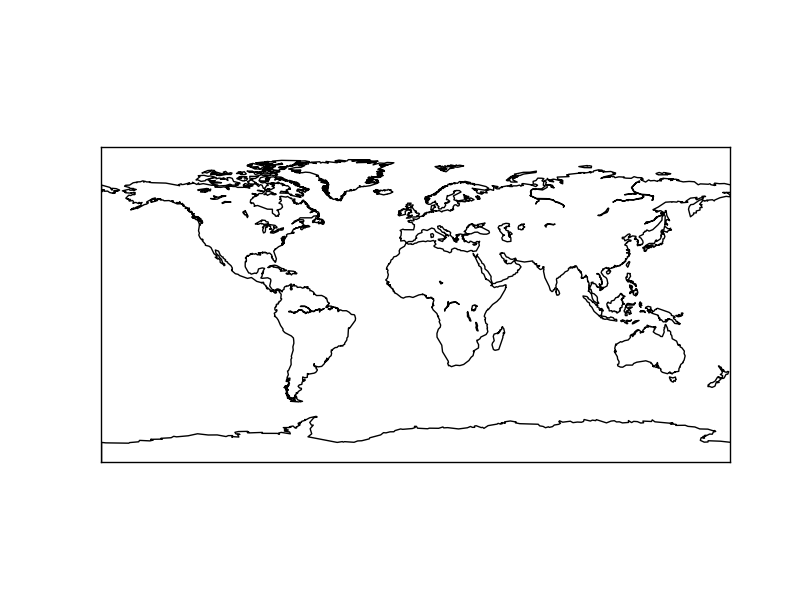
Let’s create a the simplest map:
from mpl_toolkits.basemap import Basemap
import matplotlib.pyplot as plt

map = Basemap()

map.drawcoastlines()

plt.show()
plt.savefig('test.png')
- The first two lines include the Basemap library and matplotlib. Both are necessary
- The map is created using the Basemap class, which has many options. Without passing any option, the map has the Plate Carrée projection centered at longitude and latitude = 0
- After setting the map, we can draw what we want. In this case, the coast lines layer, which comes already with the library, using the method drawcoastlines()
- Finally, the map has to be shown or saved. The methods from mathplotlib are used. In this example, plt.show() opens a window to explore the result. plt.savefig(‘file_name’) would save the map into an image.
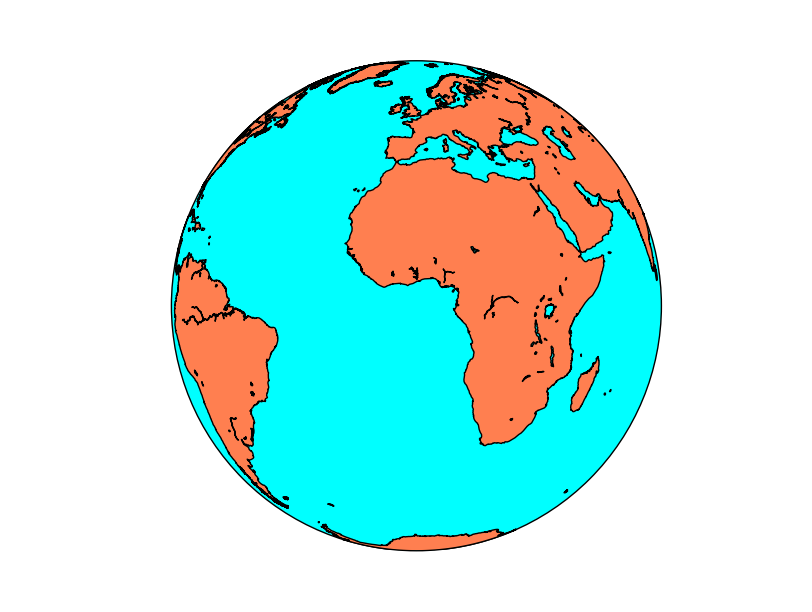
Changing the projection is easy, just add the projection argument and lat_0 and lon_0 to the Basemap contructor.
Even with the new projection, the map is still a bit poor, so let’s fill the oceans and continents with some colors The methods fillcontinents() and drawmapboundary() will do it:
from mpl_toolkits.basemap import Basemap
import matplotlib.pyplot as plt

map = Basemap(projection='ortho',
              lat_0=0, lon_0=0)

#Fill the globe with a blue color
map.drawmapboundary(fill_color='aqua')
#Fill the continents with the land color
map.fillcontinents(color='coral',lake_color='aqua')

map.drawcoastlines()

plt.show()