Working with shapefiles
The way used by Basemap to handle vectorial files is quite different from other libraries, and deserves some attention.
Basic usage
Let’s start with the easiest way to plot a shapefile:
from mpl_toolkits.basemap import Basemap
import matplotlib.pyplot as plt

map = Basemap(llcrnrlon=-0.5,llcrnrlat=39.8,urcrnrlon=4.,urcrnrlat=43.,
             resolution='i', projection='tmerc', lat_0 = 39.5, lon_0 = 1)

map.drawmapboundary(fill_color='aqua')
map.fillcontinents(color='#ddaa66',lake_color='aqua')
map.drawcoastlines()

map.readshapefile('../sample_files/comarques', 'comarques')

plt.show()
- The first parameter shapefile name must go without the shp extension. The library assumes that all shp, sbf and shx files will exist with this given name
- The second parameter is a name to access later to the shapefile information from the Basemap instance, as we will show later
There are some restrictions:
- The file must be in EPSG:4326, or lat/lon coordinates. If your file isn’t, you can use ogr2ogr to transform it
- The elements must have only 2 dimensions
- This example will show something only if the elements are polygons or polylines
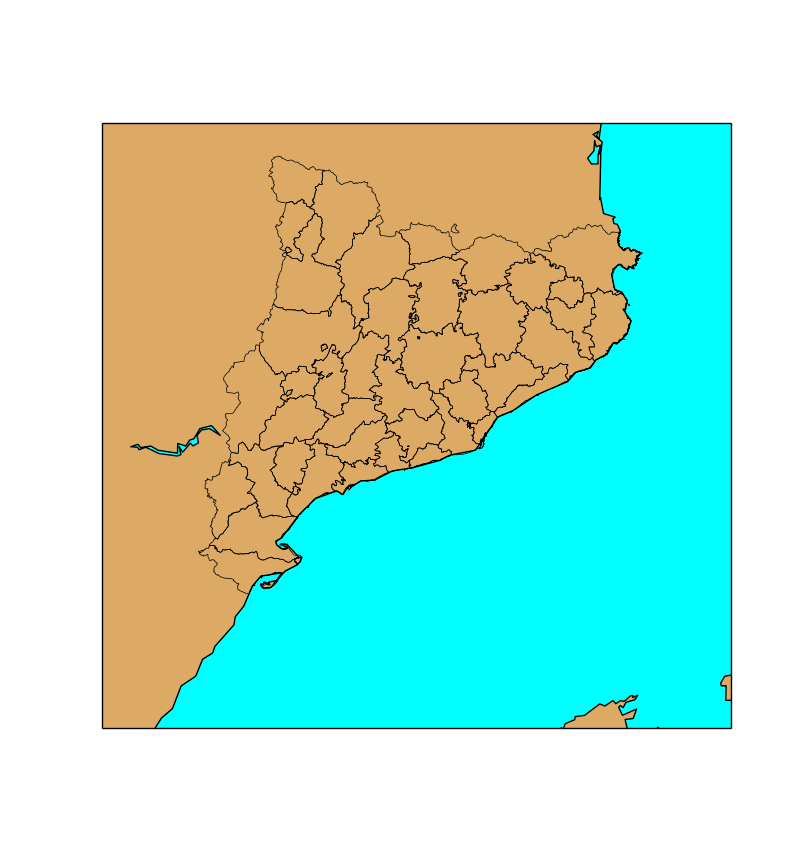
As the image shows, the result will be only the boundary of the polygons (or the polylines). To fill them, look at the last section Filling polygons
Reading point data
Plotting points is a bit more complicated. First, the shapefile is read, and then the points can be plotted using scatter, plot or the matplotlib function that fits better the needs.
from mpl_toolkits.basemap import Basemap
import matplotlib.pyplot as plt

map = Basemap(llcrnrlon=-0.5,llcrnrlat=39.8,urcrnrlon=4.,urcrnrlat=43.,
             resolution='i', projection='tmerc', lat_0 = 39.5, lon_0 = 1)

map.drawmapboundary(fill_color='aqua')
map.fillcontinents(color='#ddaa66',lake_color='aqua')
map.drawcoastlines()

map.readshapefile('../sample_files/comarques', 'comarques')

lightning_info = map.readshapefile('../sample_files/lightnings', 'lightnings')

print lightning_info

for info, lightning in zip(map.lightnings_info, map.lightnings):
    if float(info['amplitude']) < 0:
        marker = '_'
    else:
        marker = '+'
    map.plot(lightning[0], lightning[1], marker=marker, color='m', markersize=8, markeredgewidth=2)

plt.show()
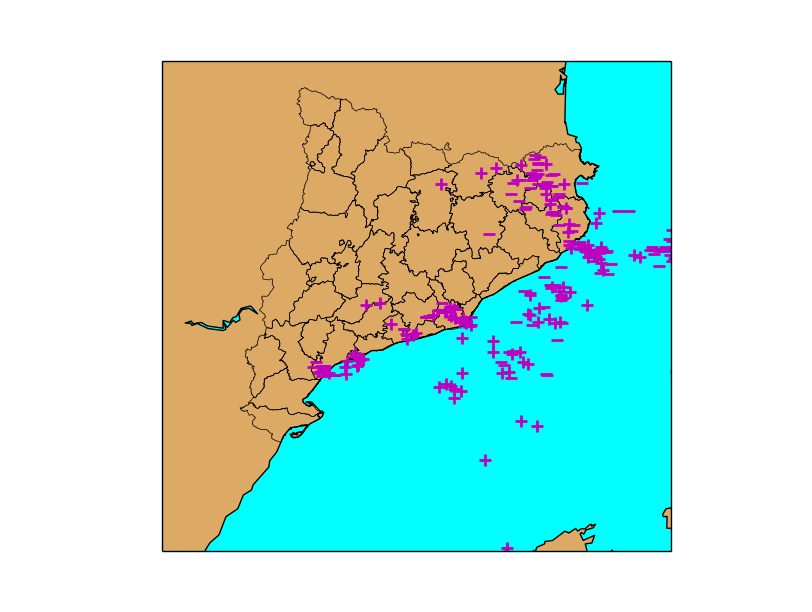
The example shows the lightnings fallen over Catalonia during a storm
- The second parameter has been named lightnings, and the Basemap instance map, so the shapefile elements can be accessed using map.lightnings for geometries and map.lightnings_info for accessing the elements fields
- The shapefile method returns a sequence with the number of elements, the geometry type with the codes defined here and the bounding box
- Line 17 shows a possible way to iterate all the elements
- zip will join each geometry with its field values
- each element can be iterated with a for as when iterating a dict
- In the example, a field named amplitude can be used to guess if the lightning had positive or negative current and draw a different symbol for each case
- The points are plotted with the method plot, using the marker attribute to change the symbol
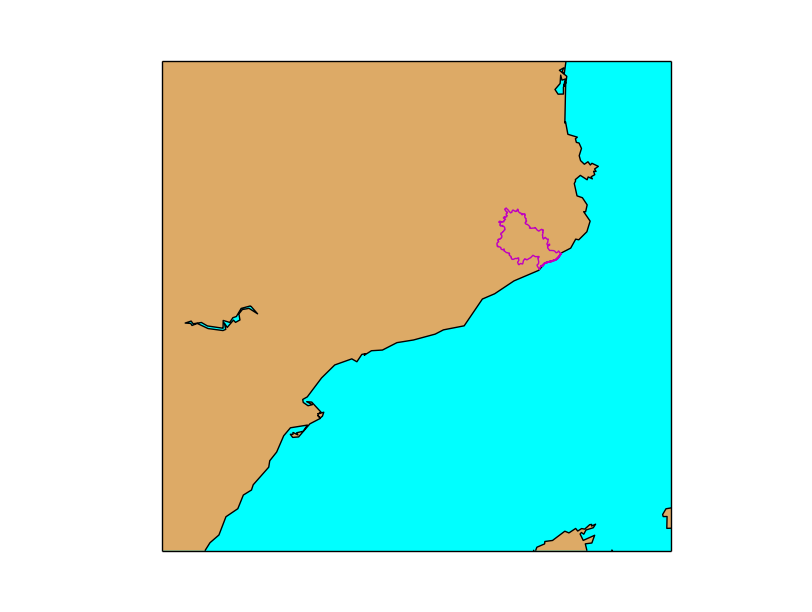
Polygon information
This example shows how to use the shapefile attributes to select only some geometries.
from mpl_toolkits.basemap import Basemap
import matplotlib.pyplot as plt

map = Basemap(llcrnrlon=-0.5,llcrnrlat=39.8,urcrnrlon=4.,urcrnrlat=43.,
             resolution='i', projection='tmerc', lat_0 = 39.5, lon_0 = 1)

map.drawmapboundary(fill_color='aqua')
map.fillcontinents(color='#ddaa66',lake_color='aqua')
map.drawcoastlines()

map.readshapefile('../sample_files/comarques', 'comarques', drawbounds = False)

for info, shape in zip(map.comarques_info, map.comarques):
    if info['nombre'] == 'Selva':
        x, y = zip(*shape)
        map.plot(x, y, marker=None,color='m')
plt.show()
- To iterate all the elements, use zip as in the last example
- There is a field called ‘nombre’ that can be used to filter. In the example only the value ‘Selva’ is selected
- To plot a line, the x and y coordinates must be in separated arrays, but the geometry gives each point as a pair. There is an explanation on how to do it ‘here <http://stackoverflow.com/questions/13635032/what-is-the-inverse-function-of-zip-in-python>’_
- The shape is plotted using the plot method, eliminating the markers to get only a line
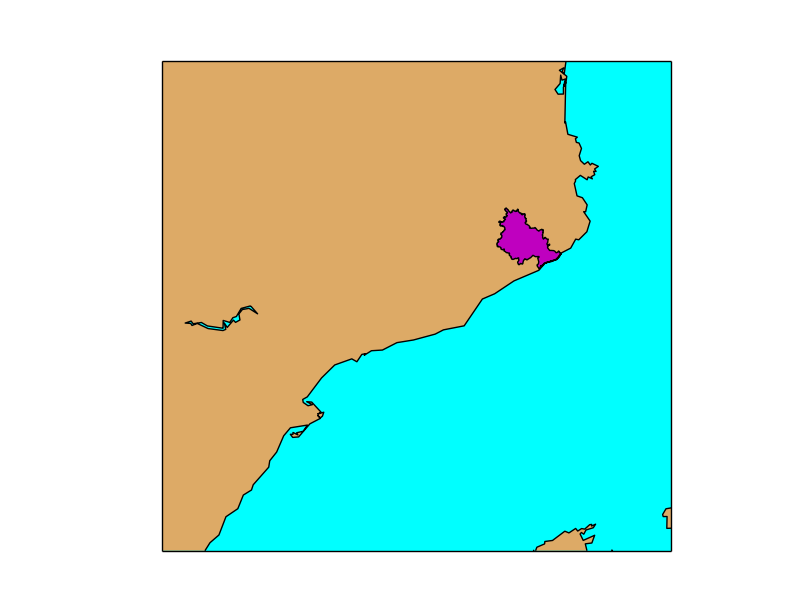
Filling polygons
The basic way to plot a shapefile doesn’t fill the polygons if this is the shape type. Here’s how to do it:
from mpl_toolkits.basemap import Basemap
import matplotlib.pyplot as plt
from matplotlib.patches import Polygon
from matplotlib.collections import PatchCollection
from matplotlib.patches import PathPatch
import numpy as np

fig     = plt.figure()
ax      = fig.add_subplot(111)

map = Basemap(llcrnrlon=-0.5,llcrnrlat=39.8,urcrnrlon=4.,urcrnrlat=43.,
             resolution='i', projection='tmerc', lat_0 = 39.5, lon_0 = 1)

map.drawmapboundary(fill_color='aqua')
map.fillcontinents(color='#ddaa66',lake_color='aqua')
map.drawcoastlines()

map.readshapefile('../sample_files/comarques', 'comarques', drawbounds = False)

patches   = []

for info, shape in zip(map.comarques_info, map.comarques):
    if info['nombre'] == 'Selva':
        patches.append( Polygon(np.array(shape), True) )

ax.add_collection(PatchCollection(patches, facecolor= 'm', edgecolor='k', linewidths=1., zorder=2))

plt.show()
- matplotlib uses a class called PatchCollection, which is a set shaped to add filled polygons, as explained at the official docs.
- The shapes, in this case, are of the type Polygon. To create it, the coordinates must be in a numpy array. The second argument sets the polygon to be closed
I learned it how to do it at StackOverflow