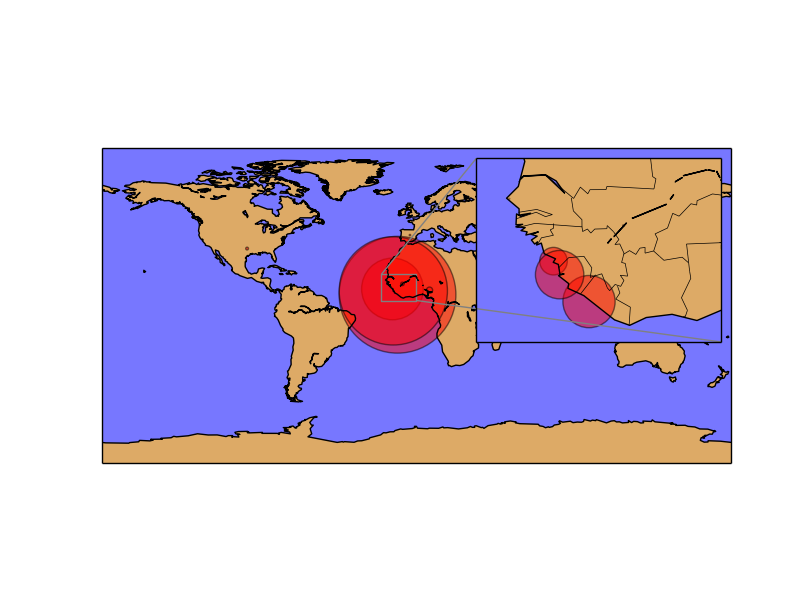
Inset locators
Insert locator is a cool class that zooms a part of the plot and draws it on the plot itself, showing the zoomed zone.
from mpl_toolkits.basemap import Basemap
import matplotlib.pyplot as plt
from mpl_toolkits.axes_grid1.inset_locator import zoomed_inset_axes
from mpl_toolkits.axes_grid1.inset_locator import mark_inset
import numpy as np

fig = plt.figure()
ax = fig.add_subplot(111)

map = Basemap(projection='cyl',
              lat_0=0, lon_0=0)

map.drawmapboundary(fill_color='#7777ff')
map.fillcontinents(color='#ddaa66', lake_color='#7777ff', zorder=0)
map.drawcoastlines()

lons = np.array([-13.7, -10.8, -13.2, -96.8, -7.99, 7.5, -17.3, -3.7])
lats = np.array([9.6, 6.3, 8.5, 32.7, 12.5, 8.9, 14.7, 40.39])
cases = np.array([1971, 7069, 6073, 4, 6, 20, 1, 1])
deaths = np.array([1192, 2964, 1250, 1, 5, 8, 0, 0])
places = np.array(['Guinea', 'Liberia', 'Sierra Leone','United States', 'Mali', 'Nigeria', 'Senegal', 'Spain'])

x, y = map(lons, lats)

map.scatter(x, y, s=cases, c='r', alpha=0.5)

axins = zoomed_inset_axes(ax, 7, loc=1)
axins.set_xlim(-20, 0)
axins.set_ylim(3, 18)

plt.xticks(visible=False)
plt.yticks(visible=False)

map2 = Basemap(llcrnrlon=-20,llcrnrlat=3,urcrnrlon=0,urcrnrlat=18, ax=axins)
map2.drawmapboundary(fill_color='#7777ff')
map2.fillcontinents(color='#ddaa66', lake_color='#7777ff', zorder=0)
map2.drawcoastlines()
map2.drawcountries()

map2.scatter(x, y, s=cases/5., c='r', alpha=0.5)

mark_inset(ax, axins, loc1=2, loc2=4, fc="none", ec="0.5")

plt.show()
- The base scatter and map is a regular scatter plot
- The inset locator is created using the method zoomed_inset_axes
- ax is the axis to be zoomed by the inset locator
- 7 is a zoom level (to be overwritten later)
- loc is the position of the inset locator (upper right in this case)
- set_xlim and set_ylim change the zone to cover by the inset locator. Since we are working with the cyl projection, longitudes and latitudes can be used directly, without any transformation
- xticks and yticks are set to false to delete the new axis labels, which are not necessary on a map
- A new map is created using the zoomed limits and the axis created by zoomed_inset_axes. Now, all the methods will be using this new zoomed map, matching the correct zone
- The map is drawn again using the new basemap instance, to plot the zoomed zone
- mark_inset draws the lines showing the zoomed zone